Sauron Architecture
Sauron Operator
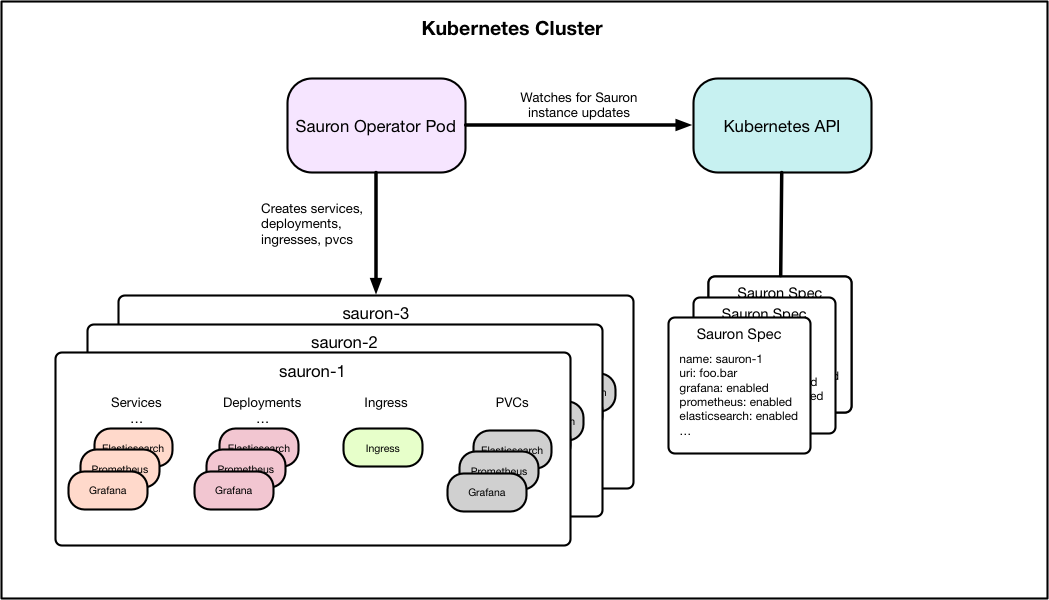
Sauron operator is the primary engine of our platform. It is a K8S operator to control the deployment and management of a "Sauron" instance: a monitoring and logging platform based on Grafana, Prometheus, OpenSearch Dashboards, and OpenSearch. The role of the Sauron Operator process itself is simple: watch the Kubernetes API for instances of the "Sauron" type, and make sure that for each, a specific set of deployments, services, PVCs, and ingress exist.
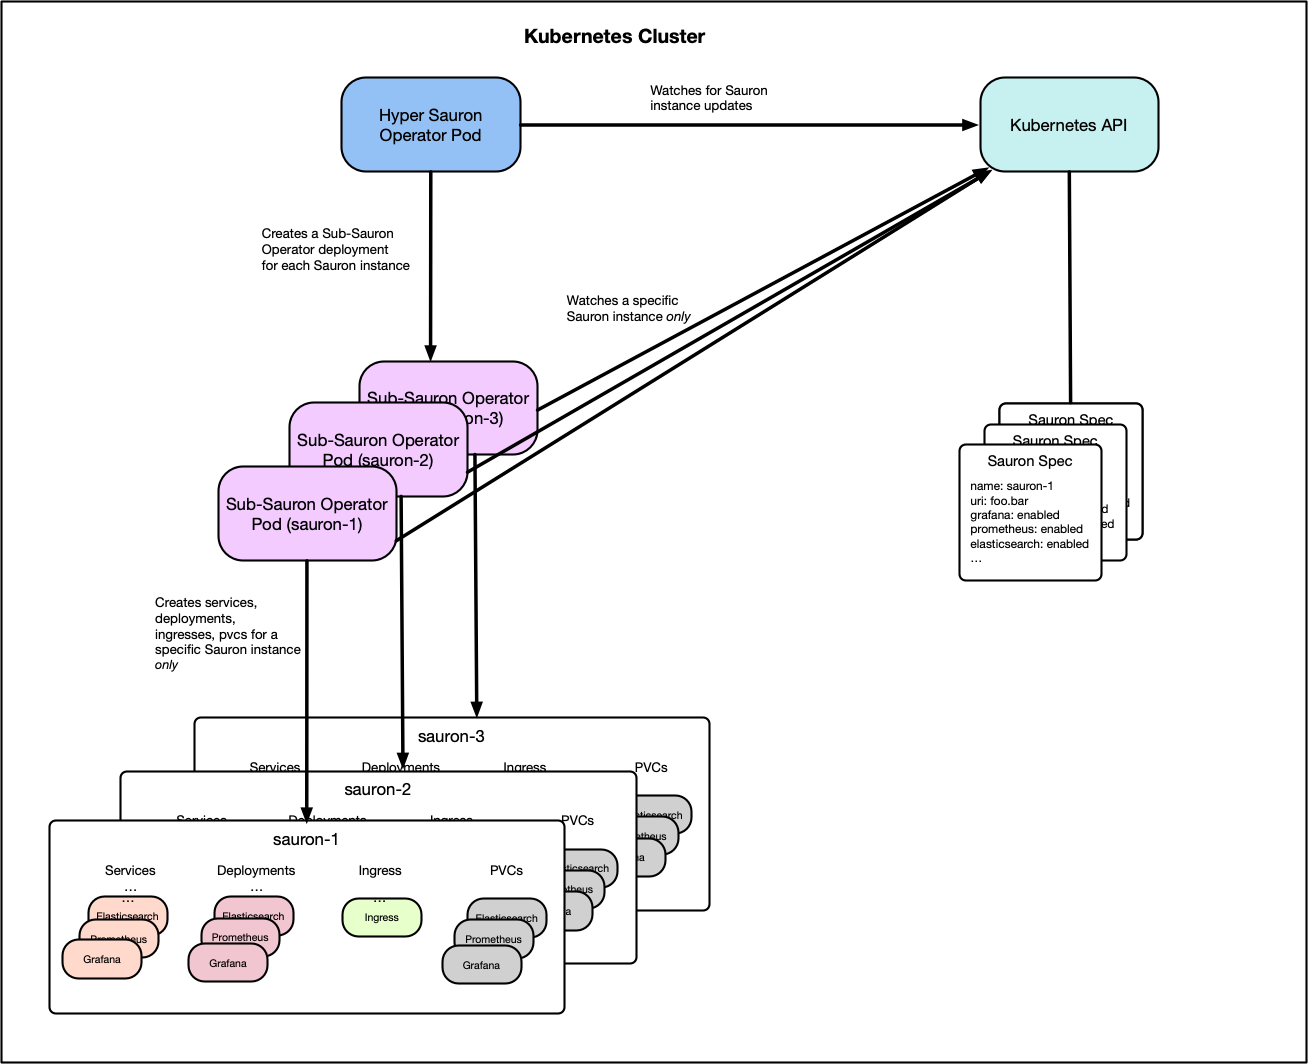
When the Sauron Operator is run in "Hyper Operator Mode", its only job is to launch a Sub-Operator for each Sauron instance. Each Sub-Operator is just a regular Sauron Operator (running in "Standard Mode"), but operating on one specific Sauron instance only.
Sauron Instance Routing
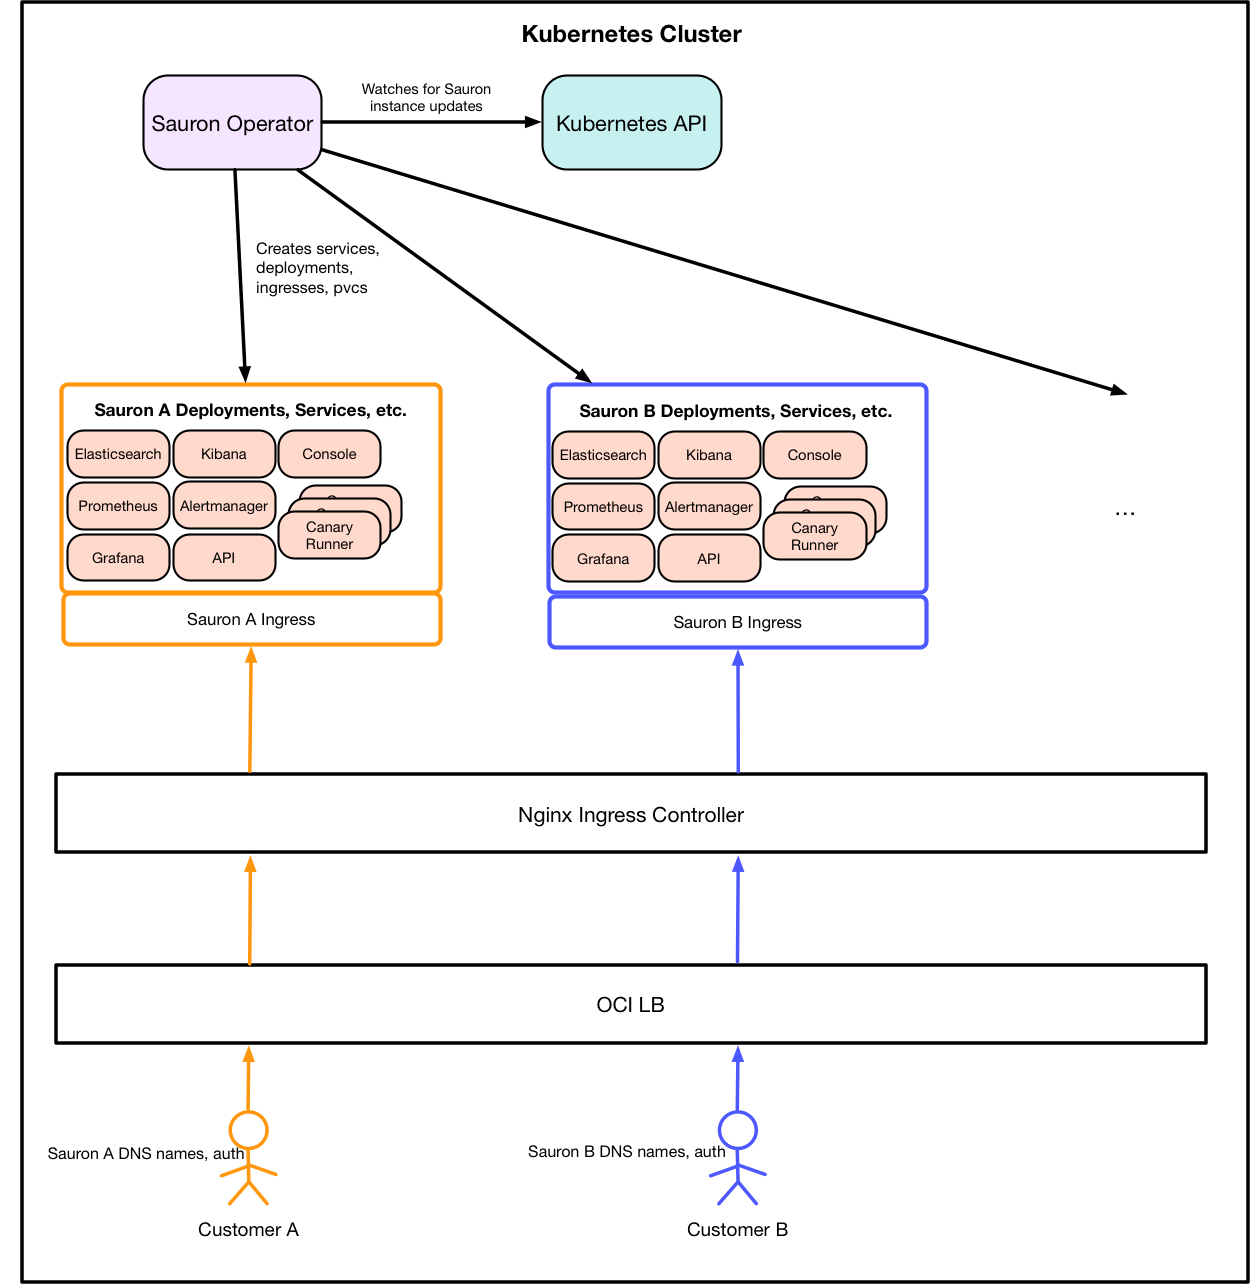
For each Sauron instance, its own set of deployments, services, PVCs, and ingress are created. Isolated routing from the outside world to a Sauron instance is done as follows:
- A single (although we support multiple) Nginx Ingress Controller is deployed within the cluster, front-ended with a service of type=LoadBalancer. This corresponds to an actual OCI LB.
- The public IP of the OCI LB is assigned a DNS A record.
- Each Sauron instance's ingress specifies:
- Its list of front-end endpoints (Grafana, OpenSearch, etc).
- HTTP basic authentication credentials.
- Certs (or annotations to instruct the Cert Manager to automatically generate certs).
- The External DNS Manager registers, for each endpoint specified in a Sauron's ingress, a DNS CNAME record pointing to the A record of the OCI LB.
- The External requests for a Sauron instance's endpoints:
- Pass through the OCI LB.
- Are routed by the Nginx Ingress Controller to the appropriate Sauron's ingress.
- The ingress provides certs and HTTP basic authentication, and routes to the backend pods for the Sauron's endpoints.
Sauron Operator Universe
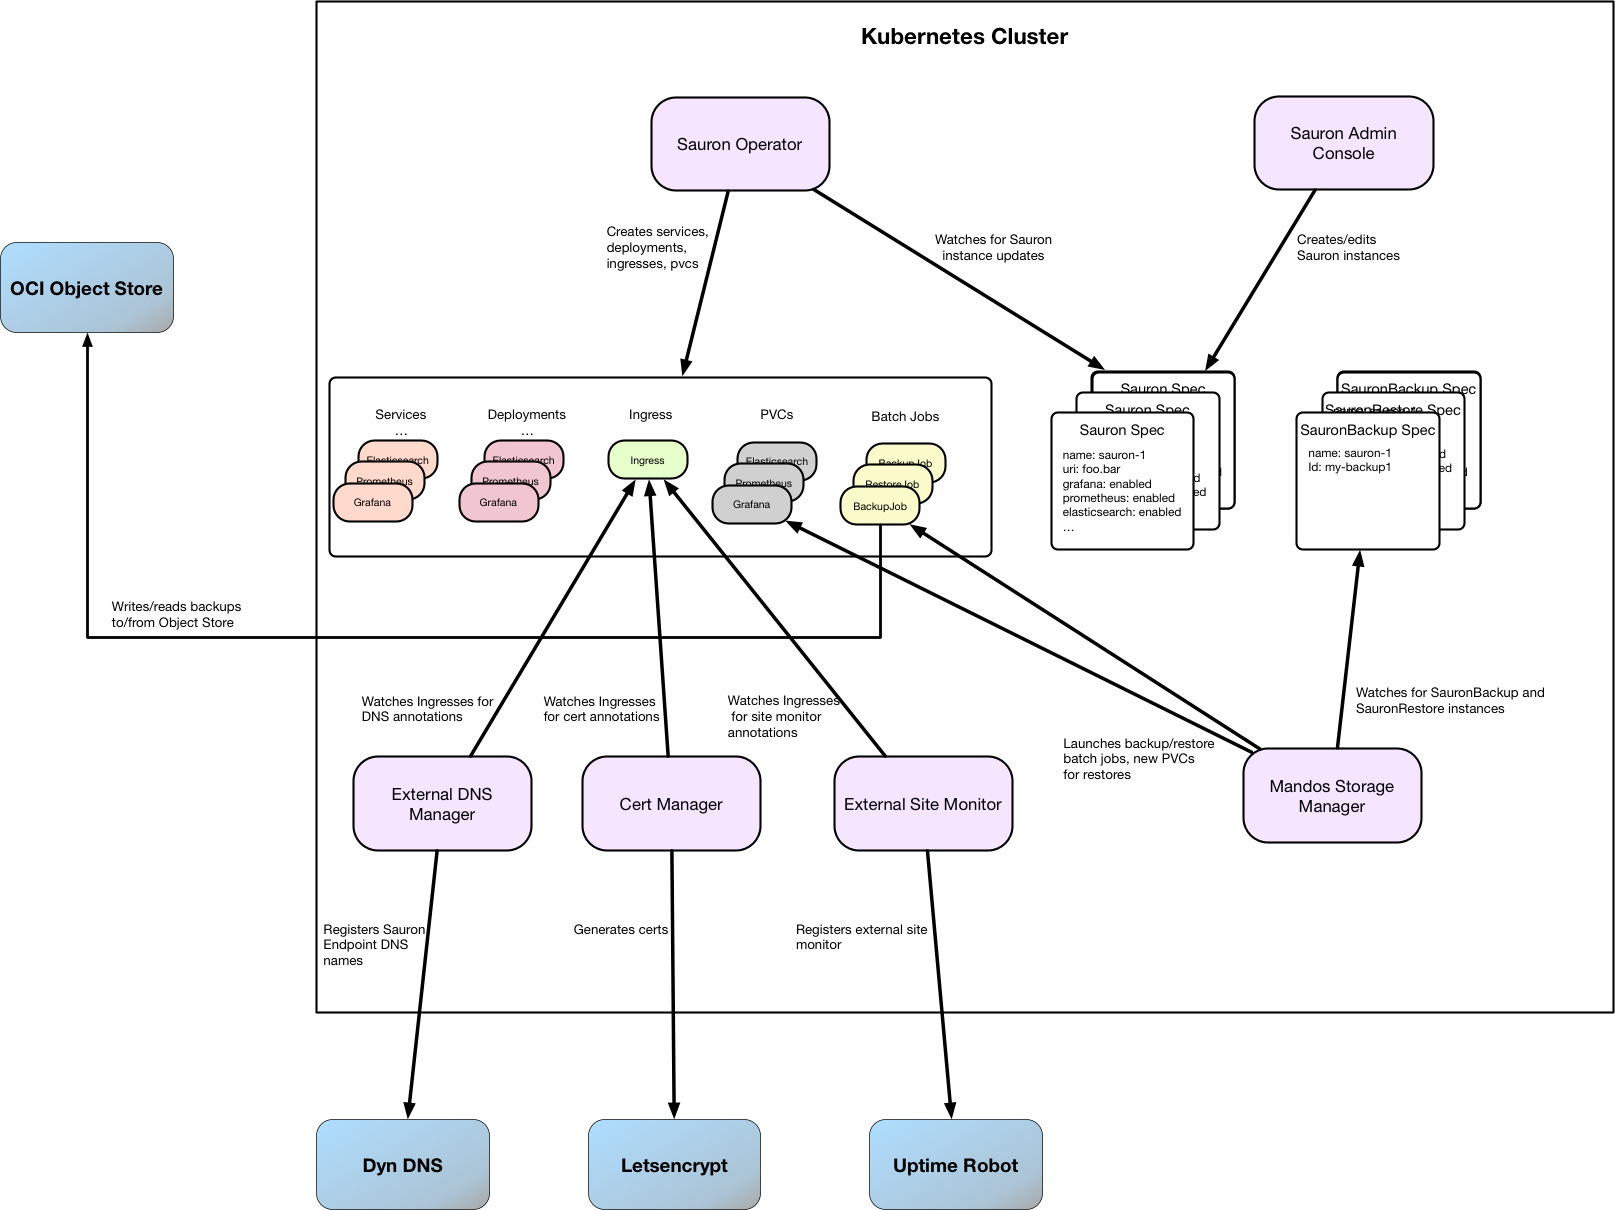
The full Sauron Operator "Universe" consists of a number of other sibling pieces to the Sauron Operator itself. The following image illustrates this. For simplicity, the Kubernetes API is left out of this picture (as all infrastructure pods use it to perform their Kubernetes CRUD operations). Specifically:
- Sauron Admin Console - provides a front-end UI for cluster admins to create and manage Sauron instances.
- Mandos Storage Manager - manages backup/restore and other data storage-related operations of Sauron instances.
- Cert Manager - handles automatic generation of certificates.
- External DNS Manager - handles automatic registration of DNS entries.
- External Site Monitor - handles automatic registration with external site monitor services like UptimeRobot.
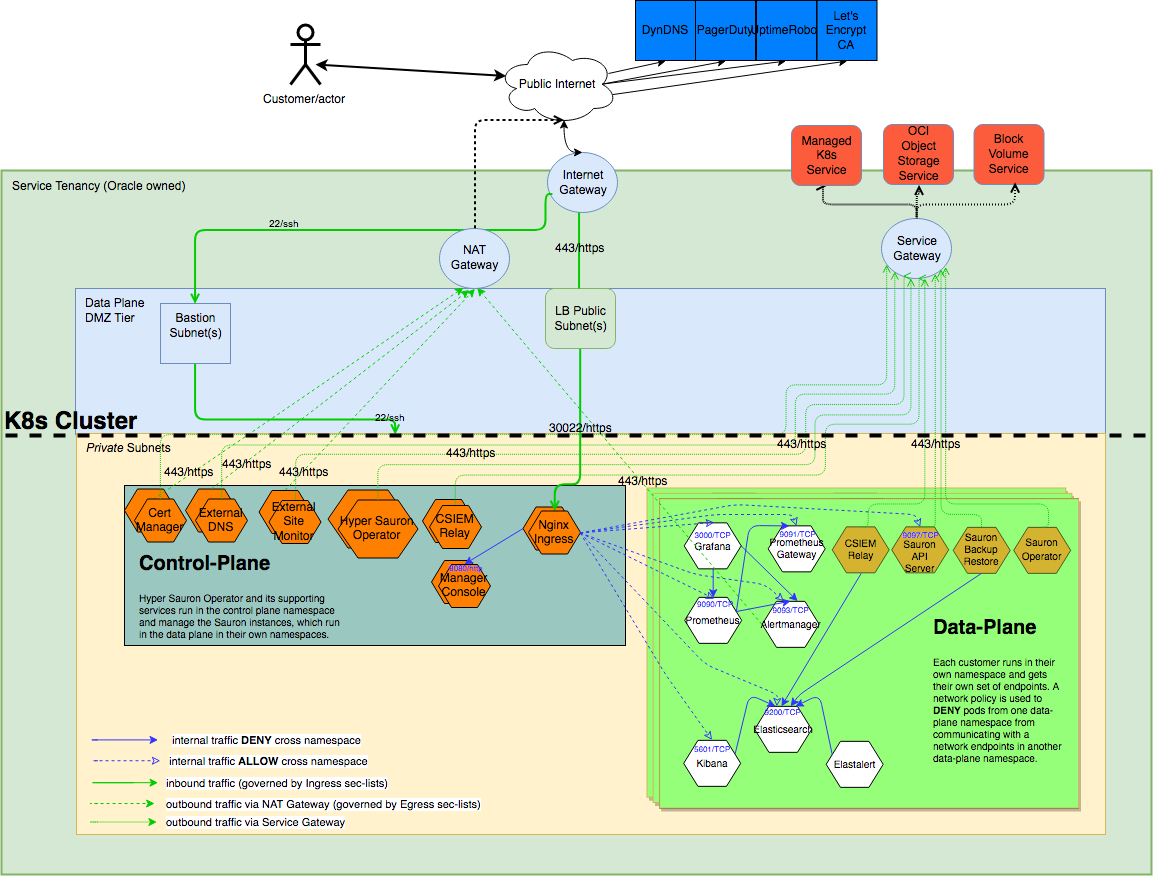
Network Architecture
Metrics Monitoring Architecture
Prometheus is a monitoring system and time-series database.
In our platform we use Prometheus as our monitoring infrastructure. It works with Alertmanager, Grafana and wide list of Exporters that provide the metrics for instrumentation. It also integrates with various receivers like Ocean/Slack for alert notifications via the Alertmanager.
Prometheus at a high level does the following:
- Scrapping metrics data from exporters
- Storing metrics data in its time-series database
- Firing off alert notifications to Alertmanager
- Returning metrics in response to API requests from clients like Grafana/Thanos etc
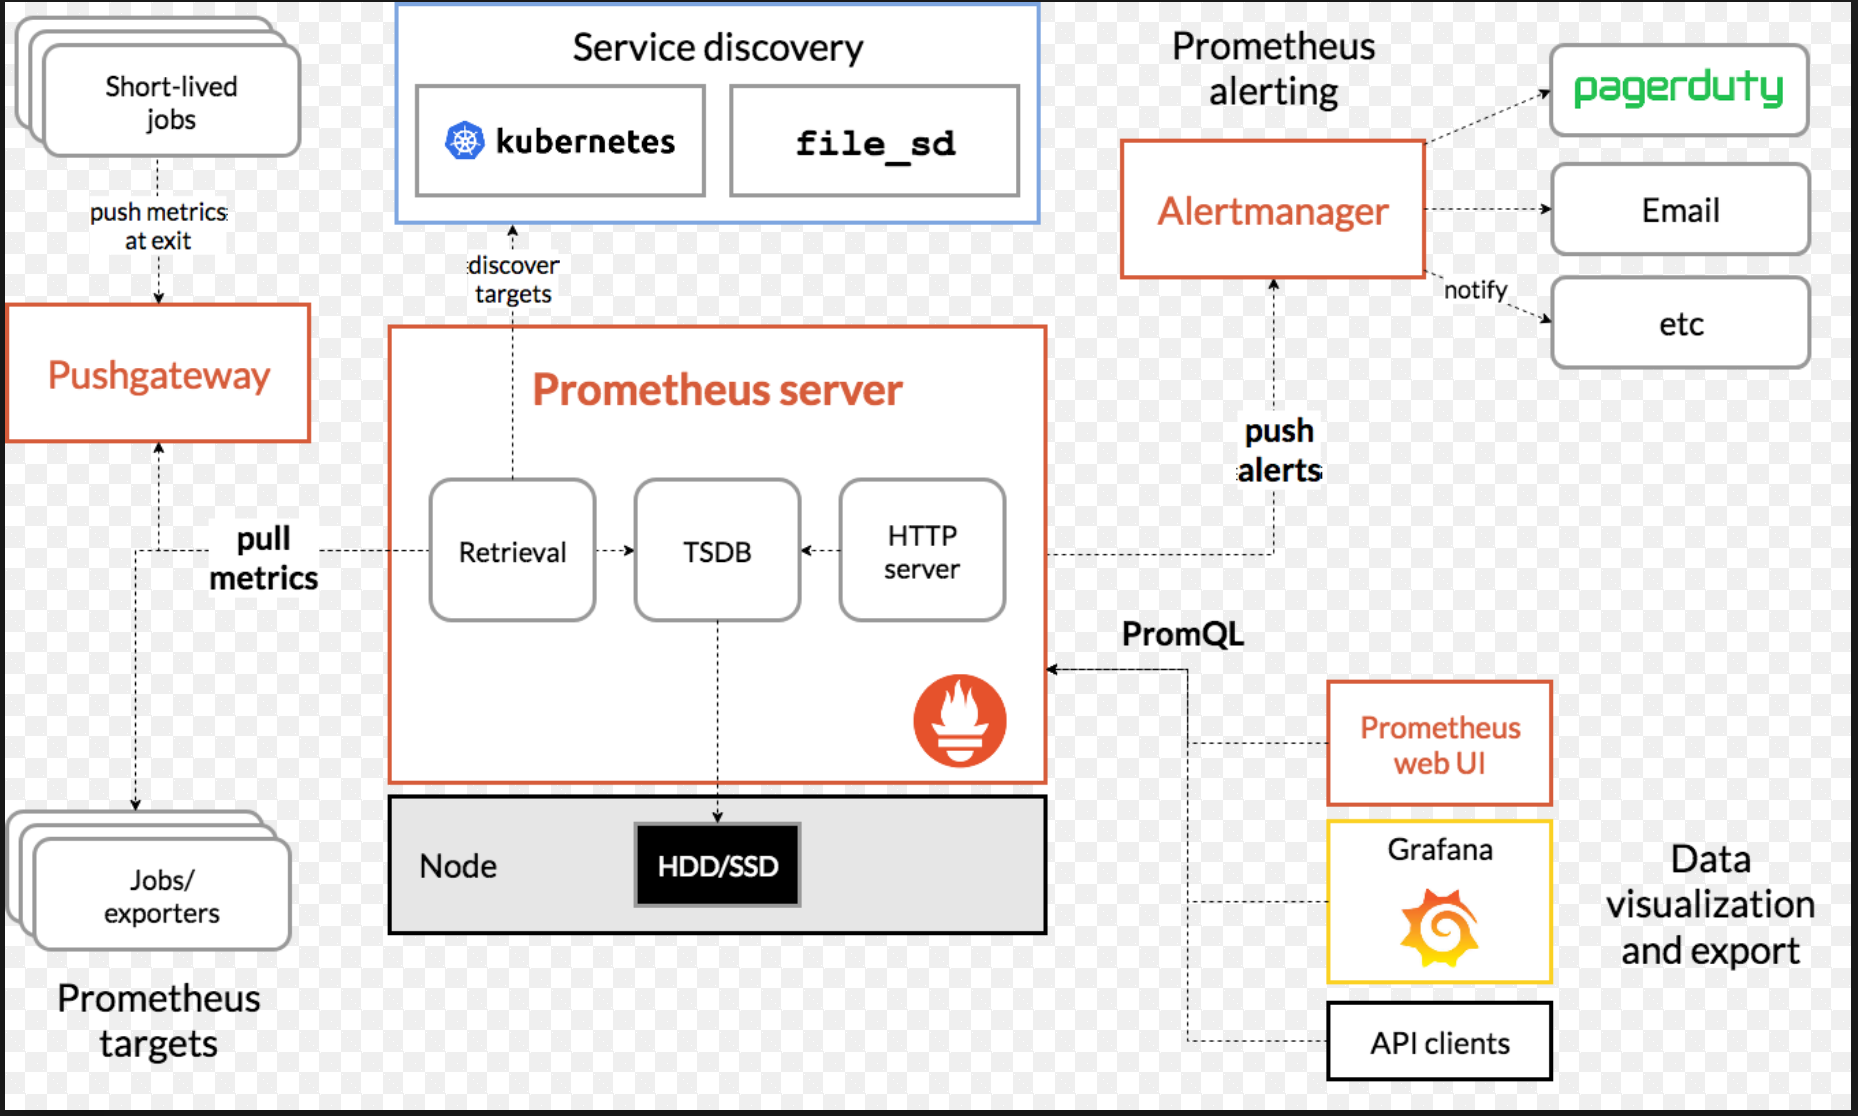
- Prometheus harvests metrics by polling all available exporters that have registered with its service discovery API. Every time it polls an exporter, it pulls down metrics which it then stores in a local time series database.
Prometheus integrates with Alert Manager to properly handle escalations to services like Slack or Ocean. An Alert is a rule which describes alert conditions using the Prometheus expression language. When alert conditions are satisfied, Prometheus passes alert notifications to Alert Manager which is responsible for escalating the alerts.
The Prometheus API service is used by other services to query for metrics data. For example, Grafana uses this endpoint to fetch the data needed by charts.
Below is a nice diagram which shows how the metrics from the various exporters and Pushgateway flow all the way to various clients like Grafana which consume the metrics, And how alerts are fired to various configured receivers.