How to enable T2 metrics for your tenancy in Grafana
-
Begin by installing the Oracle Cloud Infrastructure CLI. Follow the installation prompts to install the OCI CLI into your local environment. After the installation is complete, run
oci setup configto have the OCI CLI walk you through the first-time setup process. If you haven't already uploaded your Public Key through OCI Console, follow the instructions here to do so before proceeding. -
Configure OCI Identity Groups/Policies
- Go to your
OCI Console, click the navigation menu a.k.a the triple bar or tribar ≡, clickIdentity & Security>Identity>Groups>Create Group, and create a new group calledgrafana. - Add the user configured in the OCI CLI to the newly-created
grafanagroup.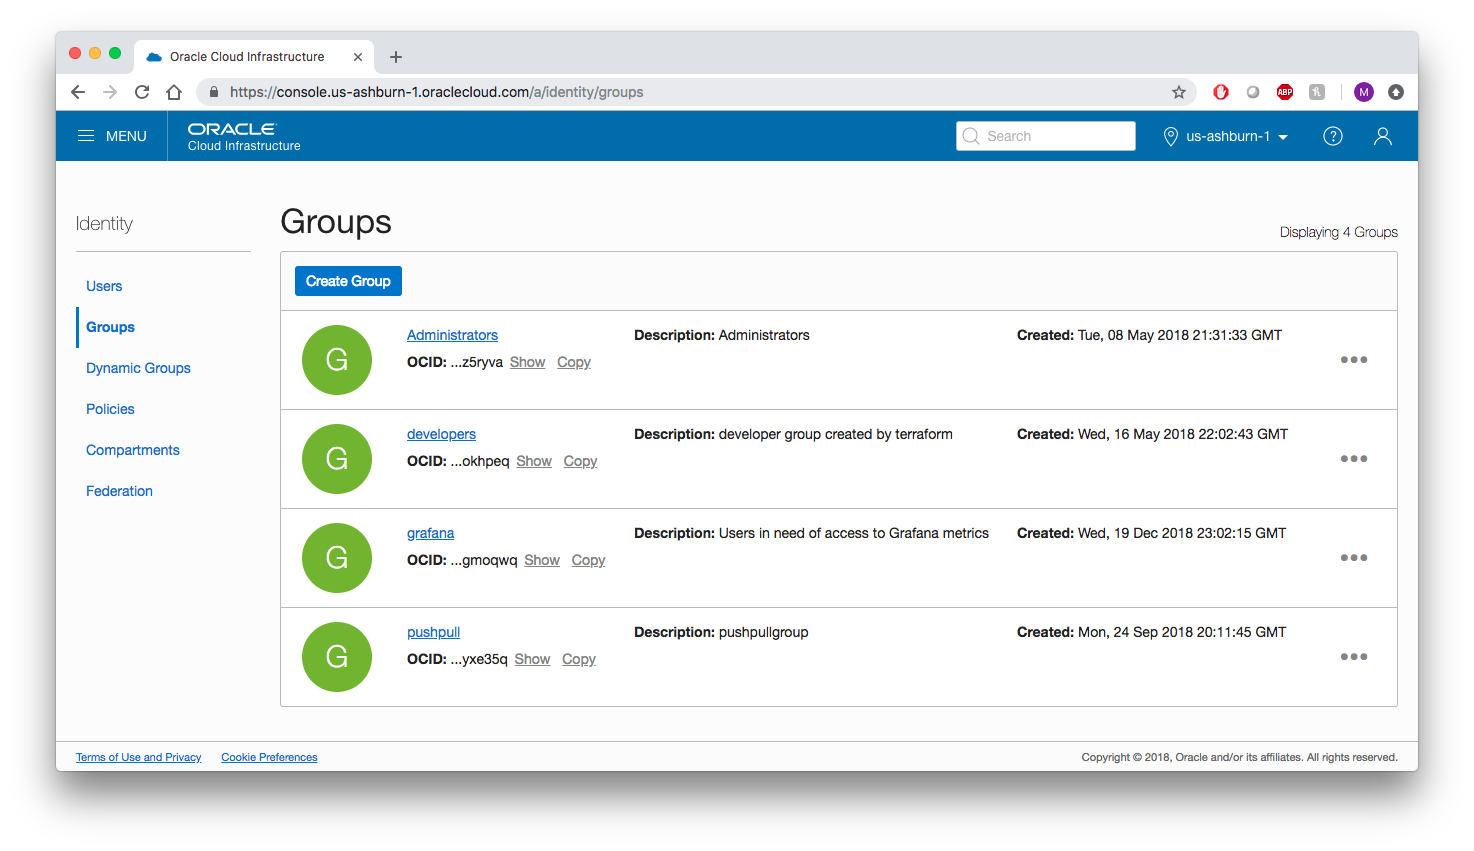
- Under
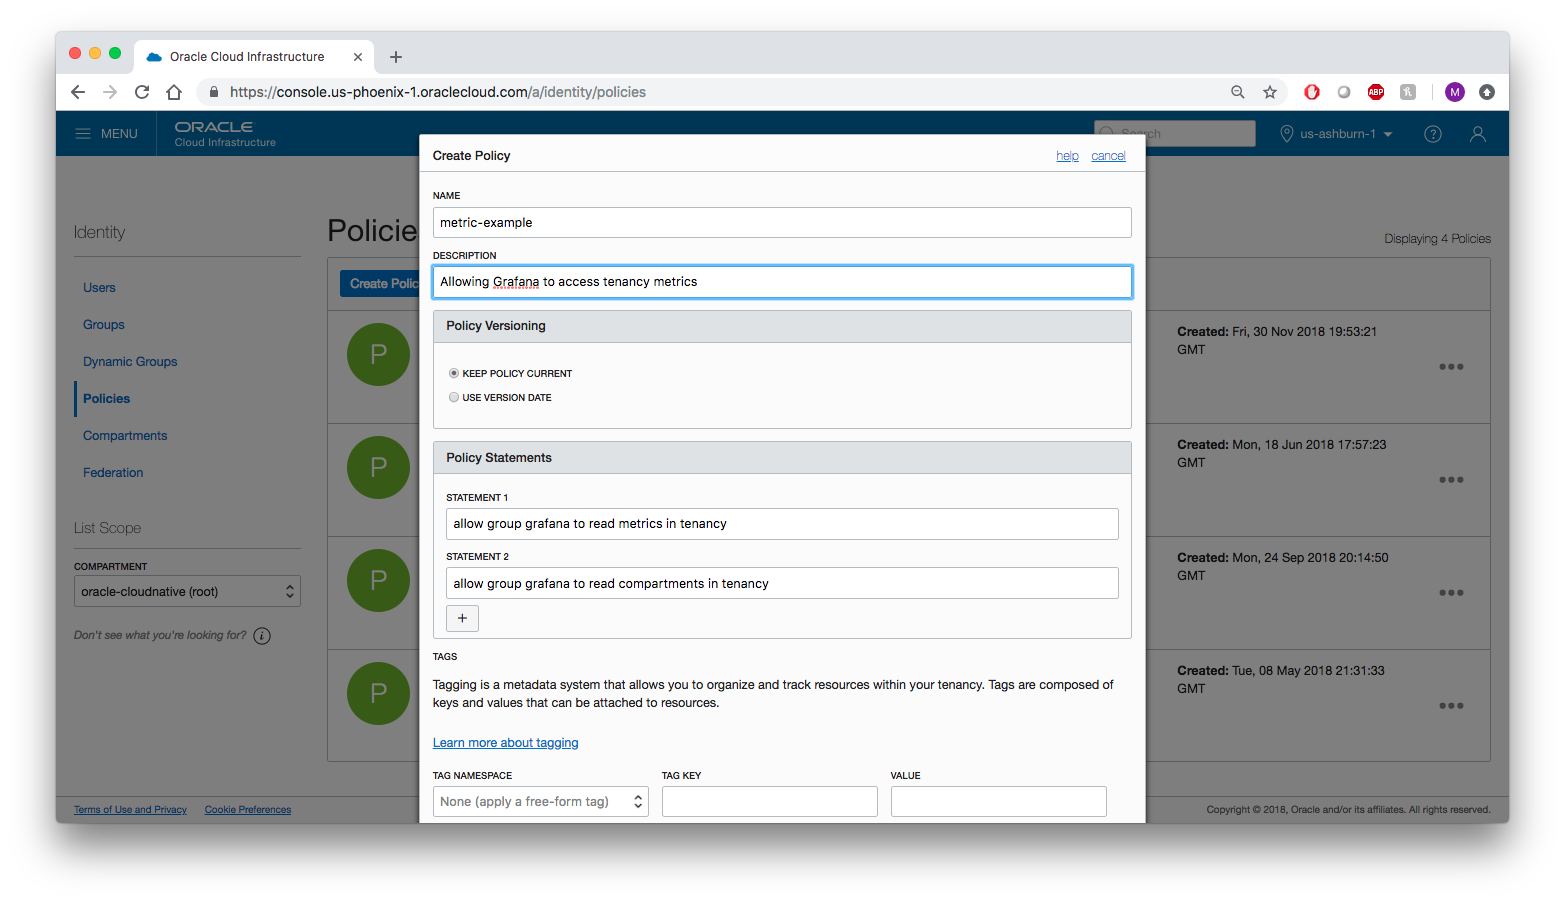
Identity & Security>Identity>Policies, clickCreate Policy, and add the followingPolicy Statementsto allowgrafanagroup to read your tenancy metrics.
- Go to your
allow group grafana to read metrics in tenancy
allow group grafana to read compartments in tenancy
-
By default the
oci setup configcommand will create a config file -$HOME/.oci/configand a private key file -$HOME/.oci/oci_api_key.pem. The information from both will be required by the oci-metrics plugin datasource in your Grafana instance so it can read T2 metrics from your tenancy. -
Create or Edit a T2 data source in Grafana
- Go to https://grafana.handu-phx.handu.developers.oracledx.com/datasources/new. Add data source, search
Oracle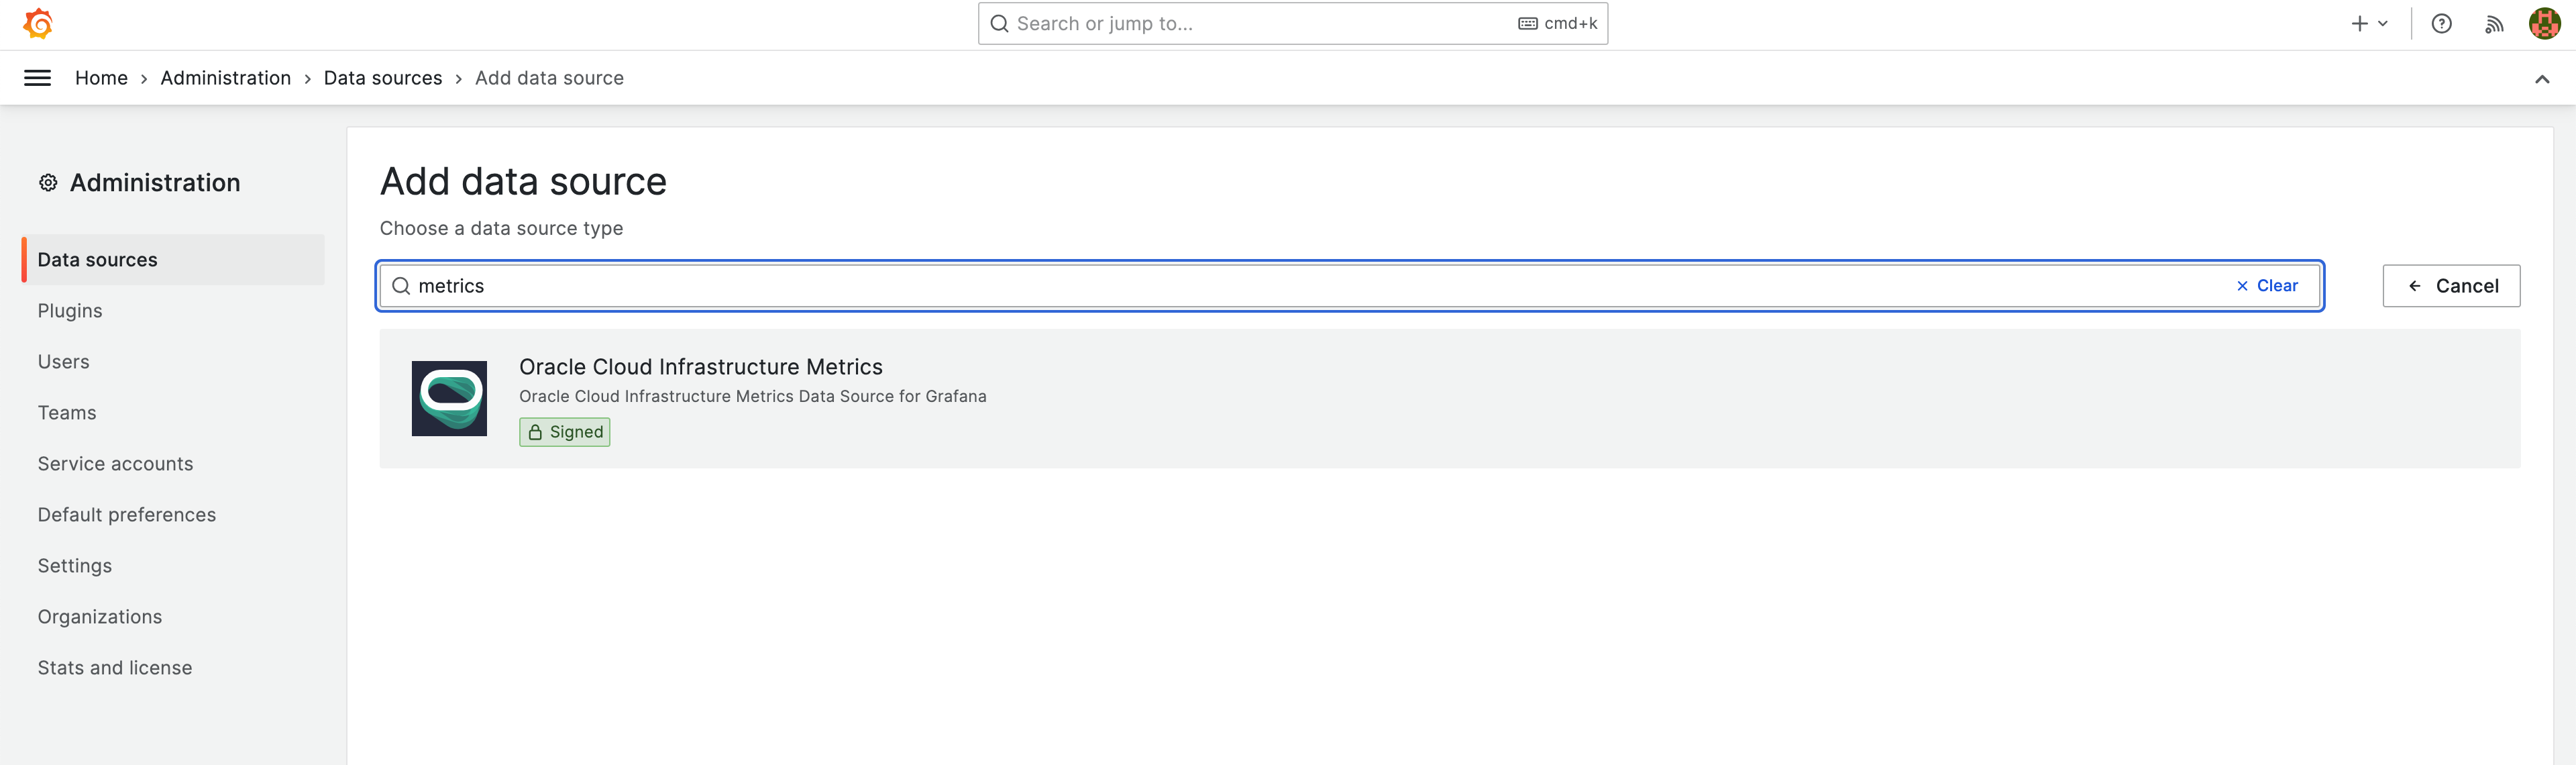
- Select
Oracle Cloud Infrastructure Metrics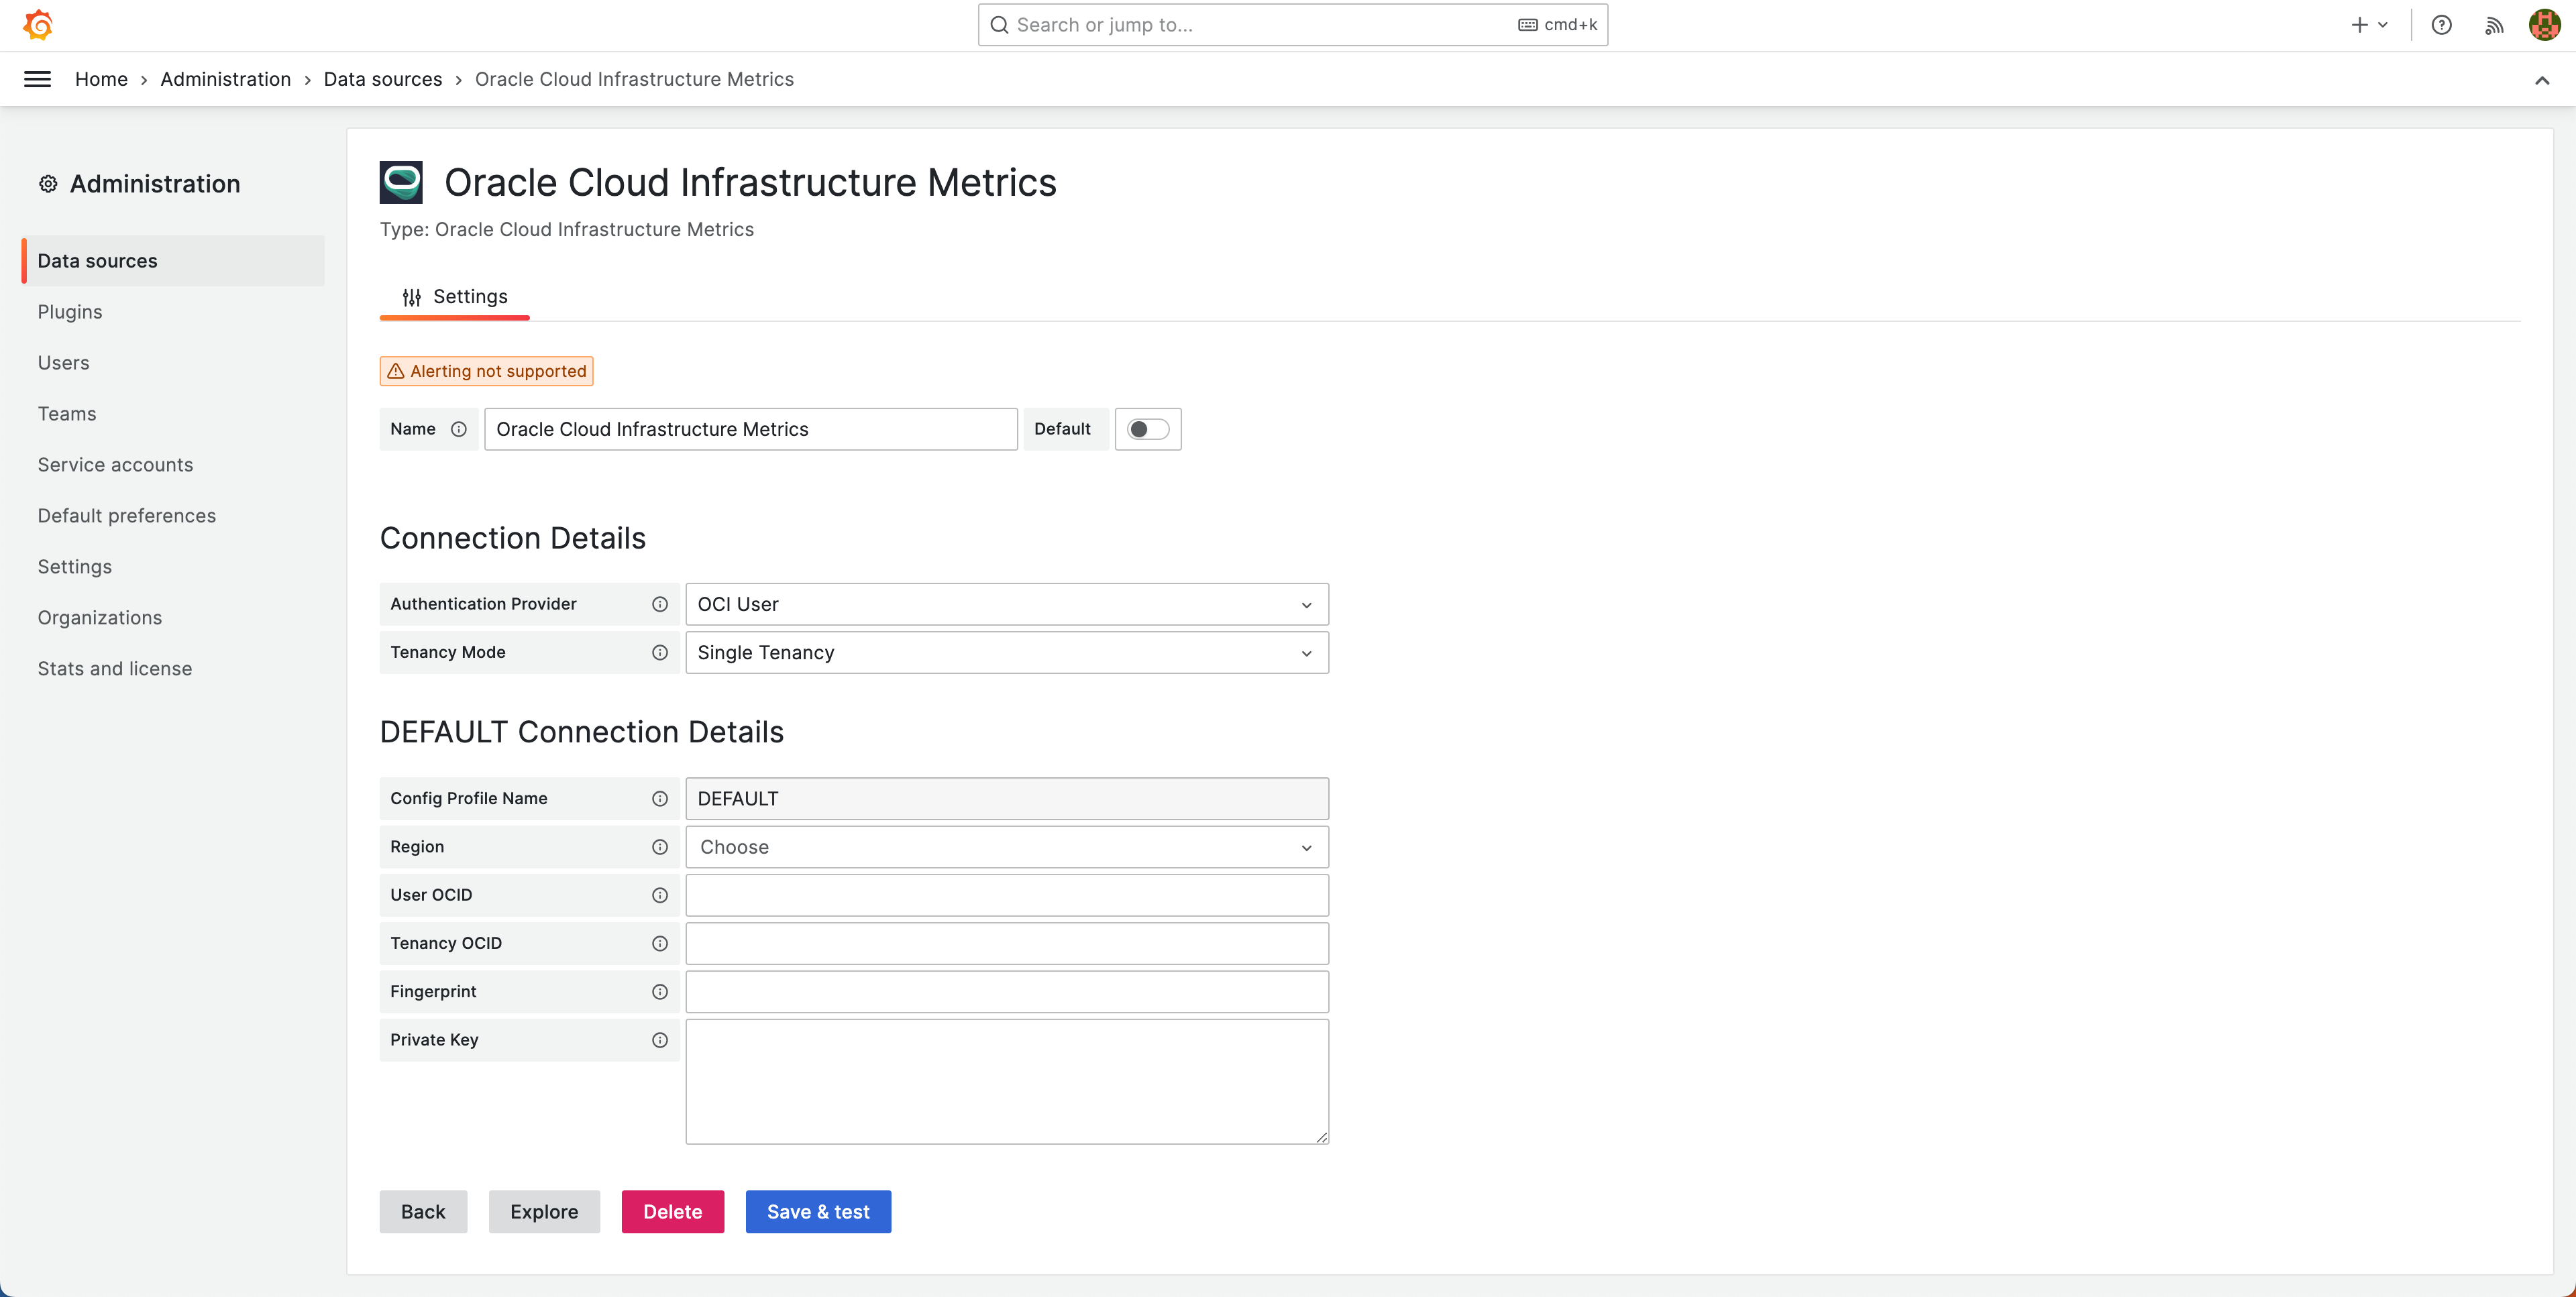
- Set
Authentication ProvidertoOCI User - Set
Tenancy ModetoSingle Tenancy - Choose the same region as in your
$HOME/.oci/configfile - Fill in your
User OCI,Tenancy OCID, andFingerprintfrom your$HOME/.oci/configfile. - Fill in your
Private Keyfrom your private key file ($HOME/.oci/oci_api_key.pemabove). - Click
Save & Test
- Go to https://grafana.handu-phx.handu.developers.oracledx.com/datasources/new. Add data source, search
-
For more information on configuring versions 4+ of the T2 metrics, plugin, please visit https://github.com/oracle/oci-grafana-metrics/blob/master/docs/migration.md
-
Optionally, you can check the logs of your Grafana instance to ensure OCI config has been correctly uploaded
- Go to https://api.handu-phx.handu.developers.oracledx.com and search for
Logs - Click on
GET /v1/log, thenTry it out - Select
grafanaas podNamePrefix, and clickExecute
- Go to https://api.handu-phx.handu.developers.oracledx.com and search for
-
IMPORTANT: For general usage of
OCI Metrics Plugin for Grafana, please visit https://github.com/oracle/oci-grafana-plugin/blob/master/docs/using.md