Sending Metrics
Teams can either instruct the Sauron Prometheus to scrape custom targets or push metrics to the Sauron Prometheus PushProx.
Security List Configuration
Your Security list needs to allow the Sauron Prometheus server access to your metrics endpoints. The following Sauron API Server endpoint allows you to dynamically determine the CIDRs of the Prometheus server(s):
curl -u sauron:mypassword https://api.handu-phx.handu.developers.oracledx.com/v1/cidrs
Example of the returned output:
["192.0.2.0/30","192.0.2.5/32","192.0.2.200/28"]
Use the maxBits query parameter to control the maximum unspecified bits of the CIDR (default is 8 meaning the first 24 bits are fixed, giving us a maximum IP address block consisting of 256 addresses).
curl -u sauron:mypassword https://api.handu-phx.handu.developers.oracledx.com/v1/cidrs?maxBits=9
Note, the Sauron Prometheus server can run on a variety of nodes to maximize availability. For this reason, it is necessary to check this endpoint regularly and white-list all of the IP addresses returned.
Pulling
You can use the Sauron API Server to configure Prometheus with any custom scrape targets you like. Sauron grants you full control over the Prometheus configuration file through the API endpoint, so your scrape targets can be equipped with any of the mechanisms supported by Prometheus. These include HTTP basic authentication over HTTPS, credentials, and TLS (client certificate). If you choose to use scraping, it is your responsibility to open up ports/security lists to allow requests from the Sauron Prometheus to your target(s).
Your Prometheus has a default configuration that you'll want to preserve and append to. So first fetch the existing Prometheus configuration:
curl -u sauron:mypassword https://api.handu-phx.handu.developers.oracledx.com/prometheus/config > /tmp/prometheus.yml
Which will look something like the following:
global:
  scrape_interval: 5s
  evaluation_interval: 5s
rule_files:
  - '/etc/prometheus/rules/*.rules'
alerting:
  alertmanagers:
    - static_configs:
      - targets: ["sauron-sauron-1-alertmanager:9093"]
scrape_configs:
 - job_name: 'prometheus'
   ...
Now, add sections under scrape_configs to scrape from your endpoints, then upload back to the API:
curl -XPUT -i -u sauron:mypassword https://api.handu-phx.handu.developers.oracledx.com/prometheus/config --data-binary "@/tmp/prometheus.yml"
Pulling metrics with TLS Enabled.
For secure installations you may need to enable https on your scrape endpoints.
Assuming you have a metrics endpoint running on https://prometheus.example.com/metrics, You can configure your Prometheus using the below
snippet.
- job_name: 'node'
    scheme: https
    tls_config:
    #  insecure_skip_verify: true
      ca_file: tls/prometheus.example.com-endpoint-chain.crt
    #  cert_file: tls/prometheus.example.com-client-crt.pem
    #  key_file: tls/prometheus.example.com-client-key.pem
    metrics_path: /metrics
    static_configs:
      - targets:
        - prometheus.example.com
We need to upload chain.crt and make it available to Prometheus. Please use the API server to upload this file.
chain.crt contains the intermediate certificate from the certificate authority that issued the certificate.
Prometheus needs the ca_file to validate the cert of the scrape endpoint.
cert_file and key_file are optional and only needed for mtls i.e. mutual TLS.
If you don't want to provide the ca_file option you could use insecure_skip_verify: true,
In this case Prometheus wont validate the cert of the TLS enabled endpoint.
2 common types of scrape configurations that Prometheus offers are: * Federated - Prometheus aggregates all metrics from other Prometheus instances, via their /federate endpoints. * Standard - Prometheus scrapes individual metrics collectors via their /metrics endpoints.
Here are scrape_config examples for each of these:
Federated
Let's say you are running your own local Prometheus instance as a low-retention cache, and you want the Sauron Prometheus to aggregate all of its metrics. You can configure as follows:
 - job_name: My-Federate-Job
   honor_labels: true
   scheme: https
   metrics_path: /federate
   params:
     'match[]':
       - '{job=~".+"}'
   basic_auth:
       username: myuser
       password: mypassword
   static_configs:
     - targets: ["prometheus.handu-phx.handu.developers.oracledx.com"]
In this example, your local Prometheus is accessible at prometheus.handu-phx.handu.developers.oracledx.com over HTTPS, protected by HTTP basic authentication.
Standard
Or, you might have some number of individual Prometheus collectors (each exposing a /metrics endpoint) that you want to scrape directly from the Sauron Prometheus. You can configure this like:
 - job_name: My-Scrape-Job
   static_configs:
     - targets: ["129.146.73.1:7500", "129.146.73.1:8500", "129.146.73.2:7500", "129.146.73.2:8500"]
In this example, your local Prometheus collectors (specified by IP address and port) are accessible over HTTP, with no authentication.
Auxiliary configuration files
A single, self-contained configuration file is the standard way to configure Prometheus and its targets.
One drawback of specifying everything in a single configuration file is that Prometheus must be restarted each time there is a change. Another issue is that the configuration file is stored in plain-text, which is not a good option for targets that require passwords or tokens to authenticate.
An alternative approach is to upload scrape-targets, passwords, and tokens as external auxiliary files,
and then reference those from the Prometheus configuration via the file_sd_config, password_file, and
authorization.credentials_file options respectively. For example:
cat > my-scrape-job.yaml << EOF
- targets:
  - 129.146.73.1:7500
  labels:
    mysauron: handu-phx.handu.developers.oracledx.com
EOF
cat > my-scrape-job.token << EOF
eyJ0eXAiOiJKV1QiLCJhbGciOiJIUzI1NiJ9.token
EOF
Upload the files to the /etc/prometheus/auxiliaryfiles/ directory of your Prometheus:
curl -XPUT -i -u sauron:mypassword https://api.handu-phx.handu.developers.oracledx.com/v1/prometheus/auxiliaryfiles/my-scrape-job.token --data-binary "@my-scrape-job.token"
curl -XPUT -i -u sauron:mypassword https://api.handu-phx.handu.developers.oracledx.com/v1/prometheus/auxiliaryfiles/my-scrape-job.yaml --data-binary "@my-scrape-job.yaml"
And reference them from the Prometheus configuration e.g.
  - job_name: My-Scrape-Job
    authorization:
      credentials_file: /etc/prometheus/auxiliaryfiles/my-scrape-job.token
    file_sd_configs:
      - files:
          - /etc/prometheus/auxiliaryfiles/my-scrape-job.yaml
Not only are the files stored securely, there is no need restart Prometheus each time they are updated.
Recommended Backend Prometheus Configuration
For service teams running Kubernetes, we recommend use of [kube-prometheus] (https://github.com/prometheus-operator/kube-prometheus#installing).
This provides an in-cluster Prometheus instance that dynamically discovers individual pods as scrape targets.
This Prometheus instance can be tuned down so as to act as a low-retention cache.
Then, your Sauron Prometheus (which runs with a higher retention) can be configured to federate from the in-cluster Prometheus.
Configuration from Kubernetes Pods
Let's say you have a custom application running as a container within a Kubernetes pod. A pattern we recommend is:
- Instrument your custom application with StatsD, for any metrics you care
about. Use the typical/default StatsD host:port:
localhost:8125. - Include
statsd-exporterwithin your pod to receive the StatsD metrics from your custom application. - Use the Prometheus Operator to dynamically discover the
statsd-exporter's metrics.
For example, let's say you have a Node.js app that exposes a simple count metric:
var StatsD = require('node-statsd'), client = new StatsD();
....
count += counterIncreaseRate;
var message = "Increasing counter to " + count;
console.log(message);
client.gauge("my_counter", count);
To first test that this app is correctly instrumented outside of a Kubernetes pod, you can just fire up a local StatsD container:
docker run -p 8125:8125/udp -p 8126:8126 keeth/statsd
And check StatsD directly to make sure that the "my_counter" gauge is showing up:
echo "gauges" | nc $HOST 8126
{ 'statsd.timestamp_lag': 0, my_counter: 18 }
Now, in your pod definition, include our statsd-exporter image. This is a lightweight image - 10MB.
Here's an example pod definition:
- name: service1
  image: phx.ocir.io/odx-sre/sauron/examples-dummy-service-service1:0.2.220
  imagePullPolicy: IfNotPresent
  ports:
  - name: web
    containerPort: 8080
    protocol: TCP
- name: statsd-exporter
  image: phx.ocir.io/odx-sre/sauron/statsd-exporter:latest
  imagePullPolicy: IfNotPresent
  ports:
  - name: statsd-exporter
    containerPort: 9102
    protocol: TCP
Expose the statsd-exporter port via a service definition:
apiVersion: v1
kind: Service
metadata:
  name: service1
  labels:
    app: service1
    k8s-app: service1
spec:
  type: NodePort
  ports:
  - name: web
    protocol: TCP
    port: 8080
    targetPort: web
  - name: statsd-exporter
    protocol: TCP
    port: 9102
    targetPort: statsd-exporter
  selector:
    app: service1
And finally, create a ServiceMonitor to configure discovery of the statsd-exporter metrics from the above service:
apiVersion: monitoring.coreos.com/v1
kind: ServiceMonitor
metadata:
  name: service1
  labels:
    k8s-app: service1
spec:
  jobLabel: k8s-app
  selector:
    matchLabels:
      k8s-app: service1
  namespaceSelector:
    matchNames:
    - default
  endpoints:
  - port: statsd-exporter
    interval: 10s
Pulling from Lockdown tenancy
If you have a metrics server running from a lockdown tenancy such that the scrape target is not reachable from Sauron Prometheus, we can use PushProx which works on same Pull model using a Client/Proxy connection.
Pushing
If you cannot enable scraping for the metrics in your environment, there are two methods available for pushing, rather than pulling, your metrics:
- OpenTelemetry Push
- This is the current preferred choice.
- PushProx
- This is the current default choice. See below, past the sections on OpenTelemetry.
OpenTelemetry && OpenTelemetry Collector
Prometheus 3+ supports the OpenTelemetry (OTel) push model. Teams are free to instrument their applications directly using OTel APIs/SDKs.
Additionally, as a courtesy, the Sauron team has built a docker image around a basic OpenTelemetry Collector implementation.
As of this writing, the latest image can be found at:
phx.ocir.io/odx-sre/sauron/opentelemetry-collector:0.20.5.
Config File
The collector requires a config file directing it at one or more Prometheus instances with push metrics enabled. As of this writing, for Sauron Prometheus, the config must also include basicauth credentials. Example:
---
receivers:
  otlp:
    protocols:
      http:
        endpoint: 0.0.0.0:4318
  hostmetrics:
    root_path: /hostfs
    collection_interval: 10s
    scrapers:
      cpu:
      load:
      memory:
      disk:
      filesystem:
      network:
extensions:
  basicauth/client:
    client_auth:
      username: mySauronUsername
      password: mySauronPassword

exporters:
  otlphttp:
    auth:
      authenticator: basicauth/client
    metrics_endpoint:
      https://prometheus.stage.team.region.oracledx.com/api/v1/otlp/v1/metrics

service:
  extensions: [basicauth/client]
  pipelines:
    metrics:
      receivers: [otlp, hostmetrics]
      exporters: [otlphttp]
Kubernetes Deployment
Teams may elect to run the collector as a deployment in their cluster(s). The following is a barebones example of such a deployment.
-
Create the namespace with
kubectl create -f otel-namespace.yaml, using the following file:--- apiVersion: v1 kind: Namespace metadata: name: otel-collector labels: name: otel-collector -
Deploy the otel-collector as a pod in a deployment.
- Note that
{{ base64_encoded_string_from_config }}should be replaced with the string derived from base64-encoding the config example, above, with actual user/pass credentials and prometheus URL. - Note also that this manifest only creates a service and not a loadbalancer and/or public address.
---
apiVersion: apps/v1
kind: Deployment
metadata:
  name: otel-collector
  namespace: otel-collector
  labels:
    name: otel-collector
spec:
  replicas: 1
  selector:
    matchLabels:
      app: otel-collector
  template:
    metadata:
      labels:
        app: otel-collector
    spec:
      containers:
      - name: otel-collector
        image: phx.ocir.io/odx-sre/sauron/opentelemetry-collector:0.132.0
        imagePullPolicy: Always
        args:
        - --config
        - /etc/otel/config.yaml
        volumeMounts:
          - mountPath: "/etc/otel"
            name: otel-collector-config
            readOnly: true
      volumes:
        - name: otel-collector-config
          secret:
            secretName: otel-collector-config
---
apiVersion: v1
kind: Secret
metadata:
  name: otel-collector-config
  namespace: otel-collector
data:
  "config.yaml": {{ base64_encoded_string_from_config }}
---
apiVersion: networking.k8s.io/v1
kind: NetworkPolicy
metadata:
  name: allow-all-egress
  namespace: otel-collector
spec:
  podSelector:
    matchLabels:
      app: otel-collector
  egress:
  - {}
  policyTypes:
  - Egress
---
apiVersion: v1
kind: Service
metadata:
  name: otel-collector-svc
  namespace: otel-collector
spec:
  internalTrafficPolicy: Cluster
  ipFamilies:
  - IPv4
  ipFamilyPolicy: SingleStack
  ports:
  - name: otel-collector-grpc
    port: 4317
    protocol: TCP
    targetPort: 4317
  - name: otel-collector-http
    port: 4318
    protocol: TCP
    targetPort: 4318
  selector:
    app: otel-collector
  sessionAffinity: None
  type: ClusterIP
- Note that
-
We can now port-forward to the service and push metrics to localhost:4318 via an arbitrary metrics-pushing device (in this example, a python program):
kubectl -n otel-collector port-forward svc/otel-collector-svc 4318:4318 -
Example python program to push metrics:
- Run with
python push_to_otel.py#!/usr/bin/env python import os import requests import time from opentelemetry import metrics from opentelemetry.sdk.metrics.export import PeriodicExportingMetricReader from opentelemetry.sdk.metrics import MeterProvider from opentelemetry.exporter.otlp.proto.http.metric_exporter import OTLPMetricExporter from opentelemetry.sdk.metrics.export import ConsoleMetricExporter ENDPOINT = os.getenv( "PROMETHEUS_ENDPOINT", "https://localhost:4318/v1/metrics" ) AUTH = os.getenv("PROMETHEUS_BASIC_AUTH") def main(): # Creates a meter from the global meter provider meter = metrics.get_meter(__name__) session = requests.Session() if AUTH is not None: session.auth = tuple(AUTH.split(":")) #send metrics to otel collector at localhost:4318(http) and console readers = [ PeriodicExportingMetricReader( OTLPMetricExporter( endpoint=ENDPOINT, session=session ), export_interval_millis=1000, export_timeout_millis=5000 ), PeriodicExportingMetricReader(ConsoleMetricExporter()) ] #setting the global meter provider metrics.set_meter_provider(MeterProvider(metric_readers=readers)) #create a counter to count the number of passes number_of_passes_counter = meter.create_counter( "bauron.test.increments", description="Number of times this metric has incremented", unit="1" ) #loop each time user hits enter or break if user enters 'q' print(f"Pushing metrics to '{ENDPOINT}'...") while True: print("Incrementing bauron.test.increments counter") #increment the number of passes counter number_of_passes_counter.add(1, {"result": "pass"}) time.sleep(1) if __name__ == '__main__': main()
- Run with
-
Observe metrics populating in the Prometheus listed in the otel config, above:
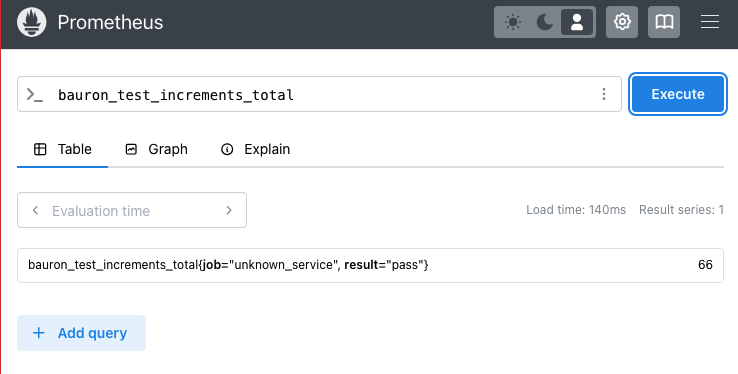
PushProx:
PushProx is a client and proxy which helps Prometheus scrape targets which are not otherwise directly accessible by the Prometheus. It has two components Client and a Proxy - Client can be run from node from where the metrics is to be scraped and scrapes in a network environment that's not directly accessible by Prometheus. The Proxy is accessible by both the Clients and Prometheus. You may also read more about PushProx on its official GitHub repository.
Using PushProx we can have below ways to pull metrics:
- Have separate PushProx client running from each metrics node - But we need to make sure each client has a unique FQDN
- Have single PushProx client running with multiple FQDN as argument.(Explained below)
- Or have a Prometheus scraping individual nodes at source and use single PushProx client scraping the Source Prometheus in Federate mode.(Recommended)
To use PushProx or to test using it please follow below steps:
Enable PushProx Proxy
You can enable PushProx for your Sauron instance using API - https://api.handu-phx.handu.developers.oracledx.com/v1/pushprox/action
Run PushProx client
Once you get PushProx server proxy enabled for your Sauron, you can download client component, which is available as a binary or docker image. See image-info page and search for Prometheus PushProx Client.
You can run PushProx client on your nodes: (If using docker image the binary is at path /app/pushprox-client)
Use Basic Auth credentials
You can use your Sauron basic auth credentials to access PushProx proxy
./pushprox-client --proxy-url=https://sauron:mypassword@pushprox.handu-phx.handu.developers.oracledx.com/ --fqdn=clientfqdn
If you do not want to pass username/password from command line, you can create a file say /tmp/creds with format username:password and set the ENV variable PUSHPROX_USER_PASSWORD_FILE=/tmp/creds and run as:
export PUSHPROX_USER_PASSWORD_FILE=/tmp/creds
./pushprox-client --proxy-url=https://pushprox.handu-phx.handu.developers.oracledx.com/ --fqdn=clientfqdn
Use OAuth 2.0 Bearer token
You can also use OAuth 2.0 Bearer token to access PushProx proxy using steps below (Note: SSO must be enabled for your Sauron PushProx endpoint in order to support this feature):
echo -n 7548652f69b4069ead716189ddfaec8194dbe199 | base64 > myTokenFile

cat myTokenFile
NzU0ODY1MmY2OWI0MDY5ZWFkNzE2MTg5ZGRmYWVjODE5NGRiZTE5OQ=

./pushprox-client --proxy-url=https://pushprox.handu-phx.handu.developers.oracledx.com/ --fqdn=clientfqdn --bearertokenfile=./myTokenFile
Provide URL whitelist
PushProx client provides a flag that is used to run with url whitelist. It is used to limit scrape to defined host:port to make it more secure.
e.g.: If you give --fqdn=clientfqdn and --url-whitelist=clientfqdn:9000 then only clientfqdn:9000 metrics will be scraped and no other ports on same fqdn will be allowed, this is done to make it more secure as otherwise any port can be scraped.
./pushprox-client --proxy-url=https://sauron:mypassword@pushprox.handu-phx.handu.developers.oracledx.com/ --fqdn=clientfqdn --url-whitelist=clientfqdn:9000
Multiple scrape targets
If we need to run client for more than one scrape target running on different hosts which are accessible from host where pushprox client will be running we can pass --fqdnList= as comma separated hostname list and remove --fdqn=, e.g. --fqdnList=host1,host2.
Once the client is running you can verify that client got registered by opening https://pushprox.handu-phx.handu.developers.oracledx.com/
The FQDN mentioned above is the scrape target host which Prometheus has to scrape, it can also be any static name provided that is reachable on the machine where PushProx client is running.
e.g.: If you want to scrape some application using localhost:port, you can use --fqdn=localhost while starting client and make sure localhost is set in environment variable NO_PROXY so that these requests are resolved locally.
Similarly one can use any static string like --fqdn=foobar, but again make sure foobar is reachable on host running client and that can be done by making entry in your /etc/hosts file like 127.0.0.1 foobar here IP will be of host running the application, in this example I have used address localhost.
Troubleshooting
You can use debug flag to troubleshoot communication between PushProx client and PushProx proxy
./pushprox-client --proxy-url=https://pushprox.handu-phx.handu.developers.oracledx.com/ --fqdn=clientfqdn --bearertokenfile=./myTokenFile --debug=true
Having a metrics exporter running on client side
To test that the client is able to help Prometheus scrape you can have your application metrics target added to your Prometheus scrape configuration or you may install any metrics generator like Node exporter which generates metrics. So for instance if your target application or custom Node Exporter runs at http://foobar:9000/metrics you can add same as a scrape target in your Prometheus scrape configuration. Once you have your metrics exporter running make sure it is accessible from the node where the PushProx client will be running.
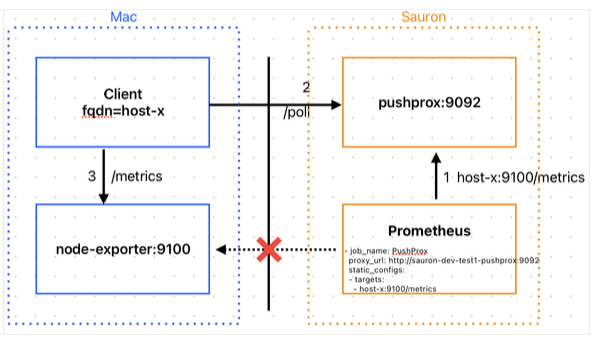
Configuring Prometheus to use PushProx while scraping
Once PushProx is enabled a custom scrape configuration with Job name PushProx gets added to your Prometheus scrape configuration which can be updated to reflect required targets using https://api.handu-phx.handu.developers.oracledx.com/.
    - job_name: 'PushProx' <Preset - Do not change>
      proxy_url: <Preset - Do not change>
      static_configs:
        - targets: <Modify - Add required targets here>
            - foobar:9000
PushProx client registers itself to PushProx server using the FQDN string which is used here as a scrape target, so for this configuration example client should be using FQDN as foobar
Verify the setup
Once you have your client running and connected to proxy and the Prometheus scrape target configured to verify that Prometheus is able to scrape the metrics from the controlled network environment you can check the status of Targets at https://prometheus.handu-phx.handu.developers.oracledx.com/targets and if that is shown as UP next steps is to verify any of the expected metrics exists in Prometheus and once the metrics is seen it means we are all done and have a working setup using PushProx.
Querying Metrics
You can query metrics directly from https://prometheus.handu-phx.handu.developers.oracledx.com to experiment with Prometheus's Query Language. You can also use https://thanos.handu-phx.handu.developers.oracledx.com to run the same queries. Thanos provides an HA and stable view of the metrics coming from your multiple Prometheus backends (which will each have very slightly different data).
Finally, you can query metrics directly from Grafana while in the process of defining Grafana dashboards.
Built-In Sauron Metrics
Your Sauron's Prometheus comes preconfigured with a set of built-in scrape targets, for metric sources of its internal
components, like OpenSearch Dashboards, OpenSearch, and Prometheus itself. These targets are labeled with a mysauron label.
If your own queries (from Grafana dashboards, Prometheus alert rules, or elsewhere) need to refer to metric names (from your own metric sources)
that are the same as those from the Sauron built-in metric sources, you can add mysauron!~".+" to these queries to omit
the Sauron built-in metric sources. For example: elasticsearch_cluster_health_number_of_nodes{mysauron!~".+"}