Shuttleproxy
The shuttle proxy is used to enable Prometheus scraping by a managed Prometheus of metric endpoints that are not easily reached due to ingress blocking by the network perimeter guarding the network hosting the metric endpoints.
Architecture Overview
The following figure depicts how the configuration of your CRS M&O instance is managed and the various configuration elements that can be used to control the targets which Prometheus scrapes where the key elements are described after the figure.
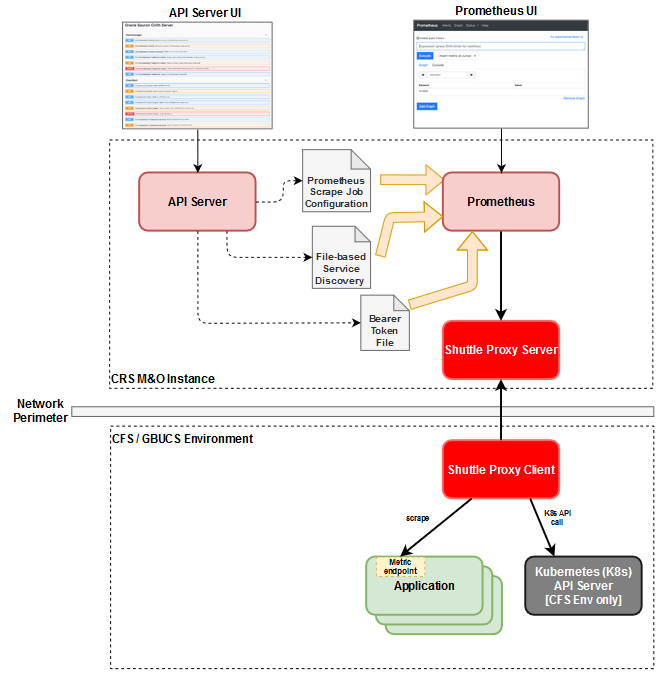
- CRS M&O instance - Represents your monitoring & observability, a.k.a. Sauron, instance in which the services, e.g. Grafana, Prometheus, etc., for your instance are running. There are additional services that included in your M&O instance, however this figure only shows those that are relevant to managing the configuration used by Prometheus to collect metrics.
- API-Server - Service within your M&O instance that provides configuration and management features for those M&O services that don't natively provide such APIs such as Prometheus and Alertmanager.
- Prometheus - Service within your M&O instance that is responsible for collecting metrics from your application services and other resources to allow you to monitor your application and the resources upon which they depend.
- Shuttle Proxy Server - Service that allows Prometheus to scrape metrics from endpoints in a remote network environment without requiring ingress into that network environment which is problematic in a production cloud environment.
Prometheus Scrape Configuration
The purpose of this section is to describe the options you have for configuring Prometheus to scrape metrics from your application services running in your SaaS environment. There are essentially three primary types of Prometheus scrape jobs:
- Dynamic - For these type of scrape jobs, Prometheus dynamically discovers the target metrics endpoints using one of its supported service discovery mechanisms such as communicating with the Kubernetes (K8s) API server. Dynamic discovery of K8s-based targets relies on each resource that supports a metrics endpoint having a set of well-known annotations applied to it to facilitate its discovery by Prometheus.
- Static - For these type of scrape jobs, each target metrics endpoint is specifically identified using its IP address or distinguished name as well as a port.
- File-based discovery - This type of scrape job provides another discovery mechanism which is controlled by you rather than Prometheus and relies on configuration files that contain a set of statically defined targets to be scraped. The configuration files can be periodically updated by an entity you manage and Prometheus will automatically pick up the changes you make to the configuration files.
The dynamic discovery scrape job is only applicable to environments where the services to be monitored are deployed on a K8s cluster whereas the last two options apply to all environments. Each of these scrape job types are discussed in more detail in the Scrape Configuration Details section below.
The following figure depicts how the configuration of your CRS M&O instance is managed and the various configuration elements that can be used to control the targets which Prometheus scrapes where the key elements are described after the figure.
-
CRS M&O instance - Represents your monitoring & observability, a.k.a. Sauron, instance in which the services, e.g. Grafana, Prometheus, etc., for your instance are running. There are additional services that included in your M&O instance, however this figure only shows those that are relevant to managing the configuration used by Prometheus to collect metrics.
-
API Server - Within the context of this scrape configuration discussion, there are three different configuration related operations that you can perform using the API server: 1) Configure the Prometheus scrape configuration file that is used by Prometheus to know what targets it needs to discover and scrape. 2) Configure one or more file-based service discovery files which identify static scrape job configurations to be used by Prometheus. These files can by changed at any time and Prometheus will automatically identify that the file contents have changed and use the updated static scrape job configurations. 3) Configure the credentials that should be used by Prometheus when communicating with a service to discover targets to be scraped, such as the K8s API server to discover services, endpoints, or pods that have a metrics endpoint.
- CFS / GBUCS Environment - Represents the CFS or GBUCS based environment in which your SaaS service is deployed.
- Shuttle Proxy Client - Component that communicates with the Shuttle proxy server in your M&O instance to facilitate the scraping of metrics endpoints from application services as well as communicating with the K8s API server for resource discovery. Since the Shuttle proxy client initiates the communication with the Shuttle proxy server this means that you do not need to arrange ingress into the environment where your application services are deployed. Instead you just need to arrange egress which is generally much easier approval to obtain instead of ingress especially for applications that need to meet various compliance standards such as PCI.
- Application - Represents the services of the application that provide a Prometheus compatible
/metricsendpoint from which you want your M&O instance to periodically collect metrics. - K8s API server - Kubernetes API server for the K8s cluster where a GBU application is deployed. If you configure a dynamic discovery scrape job within your Prometheus then Prometheus can communicate with the K8s API server to discover the relevant K8s resources that have a metrics endpoint to be scraped. Only applies to GBU applications deployed in CFS environments.
Next, we provide more details on how you configure various types of Prometheus scrape jobs.
Dynamic Discovery Prometheus Scrape
For more information see Dynamic Discovery Prometheus Scrape
Pod Dynamic Discovery Scrape Job Example
For more information see Pod Dynamic Discovery Scrape Job Example
Service Endpoint Dynamic Discovery Scrape Job Example
For more information see Service Endpoint Dynamic Discovery Scrape Job Example
Dynamic Prometheus Scrape Using Shuttle Proxy Domain Feature
For more information see Dynamic Prometheus Scrape Using Shuttle Proxy Domain Feature
File-Based Service Discovery Scrape
For more information see File-Based Service Discovery Scrape
Static Prometheus Scrape Jobs
Static scrape jobs are the most straightforward scrape job option in Prometheus but there can be many variations.
Basic Static Prometheus Scrape Job
For more information see Basic Static Prometheus Scrape Job
Static Prometheus Scrape Using Shuttle Proxy Domain Feature
For more information see Static Prometheus Scrape Using Shuttle Proxy Domain Feature
Federating Metrics from Prometheus Servers using Shuttle Proxy
For more information see Federating Metrics from Prometheus Servers using Shuttle Proxy
Domains
Shuttle Proxy (SP) v1.2.2 introduced the ability of a single SP server to support multiple SP clients in different network domains. This allows GBU partner teams to have a single M&O instance to monitor their service elements that were deployed across various network domains to ensure that the various service elements for different tenants were isolated. The partners using the M&I operating model or who have their SaaS service deployed in GBUCS are the cases to which this functionality is expected to be most applicable.
For more information see Domains
For more information about scraping HTTPS targets in non-default domains, see Scraping HTTPS targets in non-default domains
Shuttle Proxy Client User Guide
This section describes procedures for deploying the shuttle proxy client in various containerized environments:
-
Docker
-
Kubernetes cluster
For more information see Shuttle Proxy Client User Guide
Docker Deployment
For more information see Docker Deployment
Kubernetes Deployment
For more information see Kubernetes Deployment
Support
If you have a problem with ShuttleProxy, you can reach us through slack #gbu-monitoringandobservability-support or open a ticket on our Service Desk
IP Whitelisting / Network Rule Information
The architecture of shuttleproxy (server and client) can be somewhat confusing when trying to configure e.g. on-prem ingress and egress rules to allow connectivity between a Sauron's shuttleproxy (server) and a custoomer's shuttleproxy (client).
Customer Egress Policy
The Sauron team generally recommends whitelisting all OCI public CIDRs to the egress allowed list.
As an alternative, if the above is too broad for a customer's taste, they can whitelist the Shuttleproxy loadbalancers' IP addresses with the following caveat: any change to the Sauron cluster with respect to the Shuttleproxy service e.g. increasing the number of replicas has a high probability of updating and/or replacing said loadbalancers. The customer should be prepared to use a dynamic solution to obtain the IP and update their whitelist accordingly.
Some teams have set up automation registering the Shuttleproxy (server) public FQDN as an egress policy. This is beyond the scope of this document but this remains an additional avenue for allowing access.
Customer Ingress Policy
Generally this is unnecessary in terms of Shuttleproxy but for completeness's sake, the customer should whitelist Sauron's internet gateway to allow e.g. Prometheus to perform scrapes on additional targets. To obtain the IGW CIDRs for a given region e.g. us-phoenix-1, the follow command should prove useful:
curl -s -q https://docs.oracle.com/en-us/iaas/tools/public_ip_ranges.json | jq -r '.regions[] | select (.region=="us-phoenix-1") | .cidrs[] | select (.tags[]=="OSN") | .cidr'
Sauron Ingress Policy
In the case of on-prem customers, Sauron's own ingress rules need to be updated to allow traffice since Saurons generally only allow all OCI regions and not external internet traffic.
The customer will need to let the Sauron team know that they will be connecting from the public internet and provide the CIDRs of their firewall(s) or other egress points.